

When did Big Data make its first appearance? Most people would probably answer “In the early 2000s.” In fact, the coinage of the term “Big Data” is attributed to O’Reilly Media in 2005. However, the concept of Big Data appeared much earlier. Medieval monks analyzed one of the largest books of their time – the Bible – and compiled lists that cross-referenced important words and sections of texts. These lists called Concordances were an early, yet powerful form of text analysis that extracted useful information from a large unstructured dataset.

Bible Concordance from ca. 1230 AD, Schøyen Collection, England
Fast forward to the 20th century, when early computers were used to comb through (what was considered at that time) massive data sets to detect patterns, e.g. to discover promising locations in hydrocarbon exploration, or to search for extraterrestrial life. So is Big Data really (relatively) new? And, what is Big Data anyway?
The name itself, unfortunately, implies colossal amounts of data. While volume is one of several aspects of what we nowadays call Big Data, it is usually described as data possessing one or more characteristics of the “3 Vs”:
Volume: With the creation of the World Wide Web, and particularly with the advent of social media such as Facebook, Instagram and Twitter, smart portable devices, and Internet-of-Thing devices, the rate of generated data grew exponentially. For instance, in 2018 over 2 quintillion bytes (that’s a 2 with 18 zeros!) of data were created every day (https://www.domo.com/solution/data-never-sleeps-6). Traditional storage systems like normal file systems, and even conventional databases can be quickly overwhelmed with such a staggering amount of data!
Variety: The data generated by those systems and devices can come in two forms: Structured data always has a fixed form/format. For instance, consider a phonebook: you would find the name of the person, and the corresponding telephone number for each entry always listed in the same way. Unstructured data does not have this regular format. For instance, a post on Twitter can have text, images, hyperlinks to other web pages, and all of that without a fixed form. Text can be intermingled with pictures and those pictures can link to other web pages. The data can also be very complex, like data originating from disparate disconnected sources. Even if the dataset is not huge in size, the variety can quickly require employing Big Data storage mechanisms and processing techniques.
Velocity: Like the volume of newly generated data, the speed at which data is produced or captured explodes, too. Today, even inexpensive hardware can produce data at a rapid rate, and the number of devices capable of capturing or generating data increases by the minute. With the transition from batch processing (processing of chunks of data when “enough” data has been accumulated) over periodic processing (processing of chunks of data in regular intervals) to real-time processing (processing the data stream as it arrives), special forms of storage, both processing and analysis are necessary.
Sometimes two additional “Vs” are used to characterize Big Data:
Veracity: Regardless of volume, variety or velocity, the quality of a data set is important. The data can contain errors. For example, it might be incomplete, or it might contain duplicate data, or there might be doubts about the origin or truthfulness of the data. For instance, if two different sources report the name of a person in a slightly yet significantly different way (“Joe Smith” vs. “Joseph Smith”) one has to investigate if we are really dealing with the same person or two different people. In any case, most datasets require clean-up before they can be used in any meaningful way. The more the data set falls into the Big Data-category (as defined above), the more challenging this clean-up process becomes.
Value: There are situations when there is a huge amount of data available, but most of the data is not really pertinent in the given context. Suppose one wants to do a sentiment analysis of posts on Twitter to gauge the acceptance of a new product. First, one has to determine which of the zillions of posts are relevant to the assessment, and then one has to try to deduce the sentiment with regard to the product from those posts. This is a typical “Needle-in-the-Haystack” problem: the challenge is to identify and extract the important pieces.
Now that we know what Big Data is, let’s have a look at the processes involved in gaining insight from Big Data.
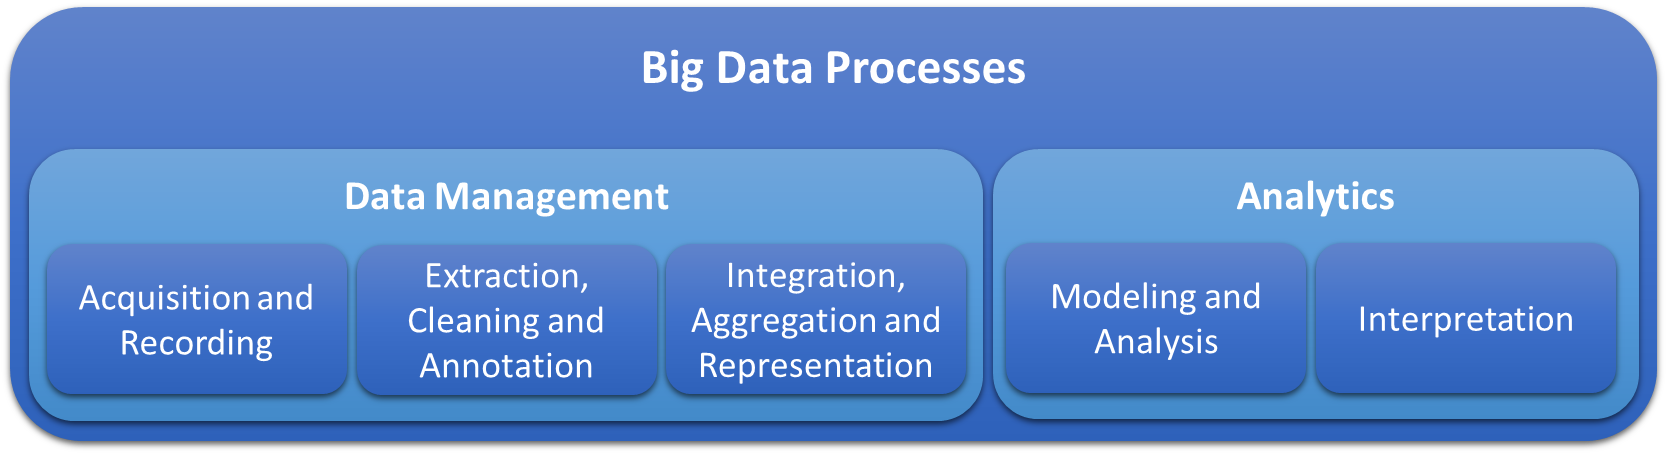
(https://www.sciencedirect.com/science/article/pii/S0268401214001066)
Data Management:
It all starts off with data acquisition, recording, and data storage. Regardless of how the data is generated, whether it originates from a single sensor, millions of smart devices or internet feeds, this data has to be channeled into receiving systems, recorded and stored. Fortunately, cloud-based services can assist with this. All big commercial cloud service providers offer mechanics that allow importing of datasets, or digest incoming data – which might arrive in chunks or streaming continuously - into cloud-based storage. The storage can be organized in structured form like in high-capacity/high-speed record-based databases, or in an unstructured form in a data depository called Data Lake.
The next step typically is to extract the pertinent data from the raw dataset and clean it. The extraction, detection, and elimination of errors, outliers, and otherwise unsuitable data can involve fixed rules, or it can employ more sophisticated algorithms such as adaptive filters based on machine learning. Whatever algorithm is used, the goal is always the same: at the end of the extraction and cleaning phase, only relevant data with known lineage and error-free content is forwarded to the next step.
Here the data of different sources might be integrated and aggregated in such a form that information can be extracted in a meaningful way. Usually, at this stage some sort of representation is invoked. For instance, the data could be described in statistical terms, like the number of data points, minimum and maximum values, averages, etc., that express an overview of the data. Or it could be visualized in graphical form.
Analysis
After all this preparation, the data is finally ready for analysis. Regardless of whether a simple linear regression or a highly sophisticated machine learning-derived model is involved, the goal is to extract information from the data that can be interpreted to support business decisions. Again, cloud services can help by providing virtually seamless integration of analytics modules and visualization with the upstream data pipeline.
Misconceptions
With all that data readily available, and more data generated every second, one can easily get the impression that processing and analyzing these humongous amounts of information can give an outlook into the future, in short, that Big Data can be used to predict the future. While in some cases the past is indeed an indication of at least the near future, the reality is that Big Data often fails to predict the correct results even when used in combination with highly sophisticated statistical analysis. Just look at the election polls! Like everywhere else it pays to take predictions about the future with a grain of salt…
Another misbelief is that Big Data is everywhere. At least it seems like everybody is talking about Big Data, right? However, the adoption of Big Data still varies vastly. The telecommunication industry is the front runner with over 90% considering Big Data “critical” or “very important” (Dresner Advisory Services 2018 Big Data Analytics Market Study). On the other hand of the spectrum, in manufacturing only about 30% are certain about its importance. Across industries even those who are convinced of Big Data’s value and usefulness, only a fraction have fully deployed respective systems. Overall the deployment rate still lingers around 50-60%.
Why is that? Could it be that the word “Big” implies “big budget” and “only available to big companies”? Nothing could be further from the truth. Particularly with the pervasive presence of cloud-based services, “pay-as-you-use” solutions that are affordable for smaller budgets have become available.
One pitfall about getting access to increasingly affordable storage and processing solutions is to indiscriminately collect all the data one can get and just feed everything into the analytics engine. This overlooks the fact that all data contain errors, outliers, and otherwise problematic data. Hence, as in the past, Big Data sets must be curated, and effective quality control and cleaning procedures have to be implemented. A Master Data Management solution can improve organization and provide higher data quality, too. Failing to observe this important fact will ensure a severe case of the proverbial “junk in – junk out” problem.
Now that we have Big Data available, we must spend a lot of effort and money to employ Machine Learning, right? No, we don’t. Big Data can be processed and analyzed with a variety of tools ranging from simple statistical models to highly sophisticated algorithms like – yes! – Machine Learning. However, the choice of algorithms and models should always be driven by the business questions to be answered along with the data available. In many situations, the good old principle K.I.S.S. (Keep it Simple and Successful) applies. In other words, don’t complicate things unnecessarily.
Go for it!
Even with all the caveats, Big Data solutions can offer potent tools to support businesses. When deployed in the proper way, they can help to extract vital information from data that could otherwise not be managed, organized or analyzed. Whether you are just starting on your Big Data journey or have a fully deployed solution and need help, or simply want to get outside ideas, CapTech can help.

